Hello & Happy 2024 to anyone who happens to be interested in the market enough to read my blog post : ) Wishing you the best of all things and especially your health and peace in 2024. Protect this with all you can and the rest of your goals are likely to fall into place.
With many still affected by affordability and unable to qualify for a mortgage, which includes being able to meet the criteria with the “stress test” in place — we will be watching as the early days before spring market unfolds to see where the market is going. Is there pent-up demand, is there affordability and/or enough consumer confidence to boost the spring market? Will there be enough listings or a constrained supply? This all remains to be seen. I do not predict markets but I do watch them closely. I will say there is an uptick in showing requests and potential buyers in my anecdotal experience. I will keep updates happening so you may be informed as the market unfolds.
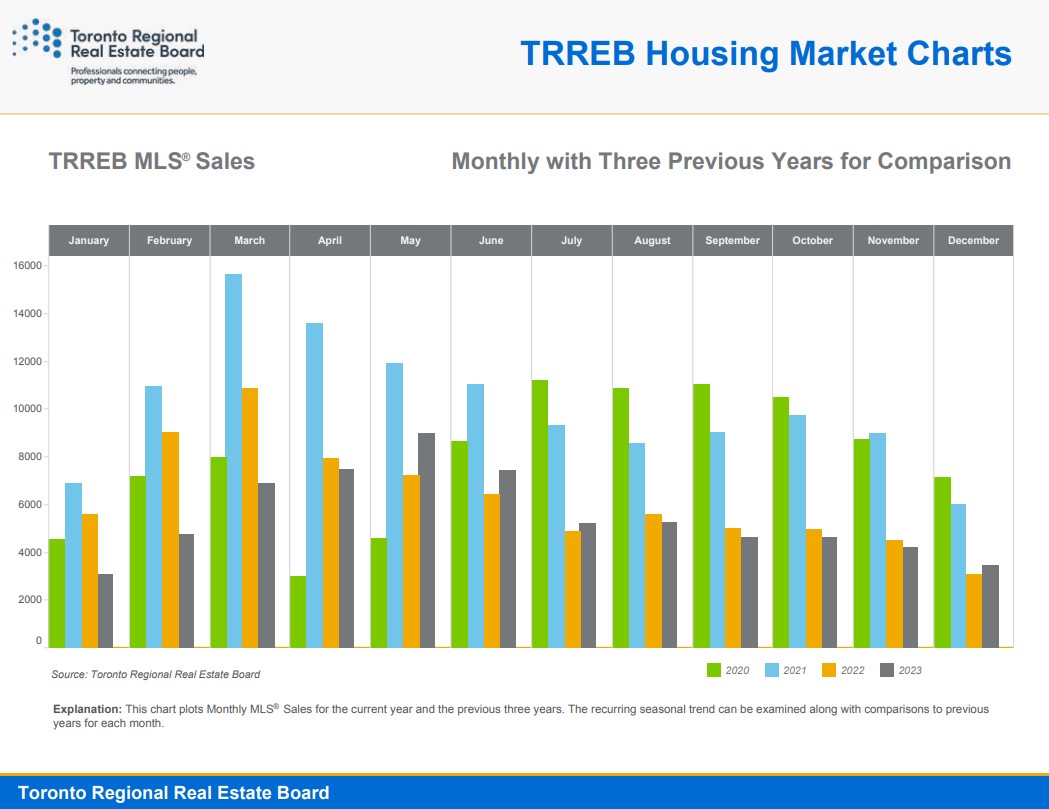
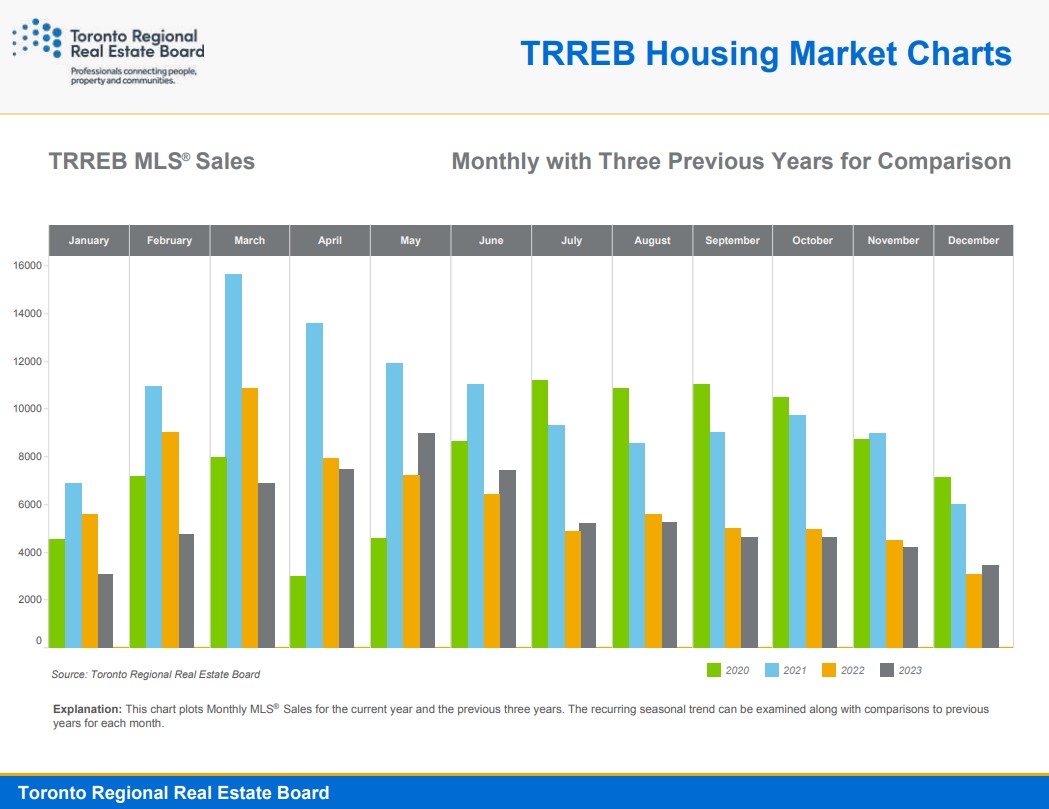
December 2023 transactions were up from October & November 2023. October to November 2023 Sales were a lower number of transactions/sales compared to October & November 2020 and 2021 and slightly lower than 2022…so it was not hard to beat.
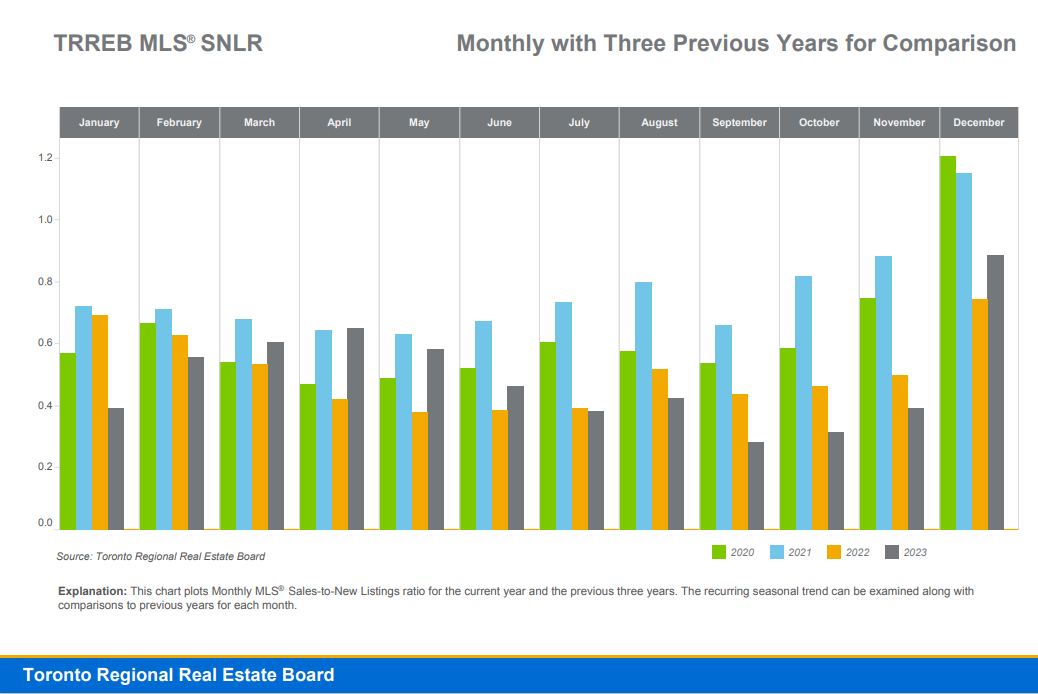
The Year over Year Comparison shows December 2023 number of transaction/sales were up slightly from December 2022 number of transactions/sales, but still not as high amount as December 2020 or 2021 sales. The increase in the number of December 2023 sales could have to do with the interest rate pause after the 3 previous Bank of Canada rate announcements. Perhaps this has instilled some consumer confidence. There were also some slightly adjusted-down mortgage rate options being offered at some providers – some fixed rates were achieved at 4.99% or 4.74%. This too could have been a reason for the December 2023 slight uptick in number of sales. Seasonally, December is not a great market indicator as it is traditionally a low volume sales month.
The Sales-to-New-Listings ratio is up 15% December 2023 compared to December 2022.
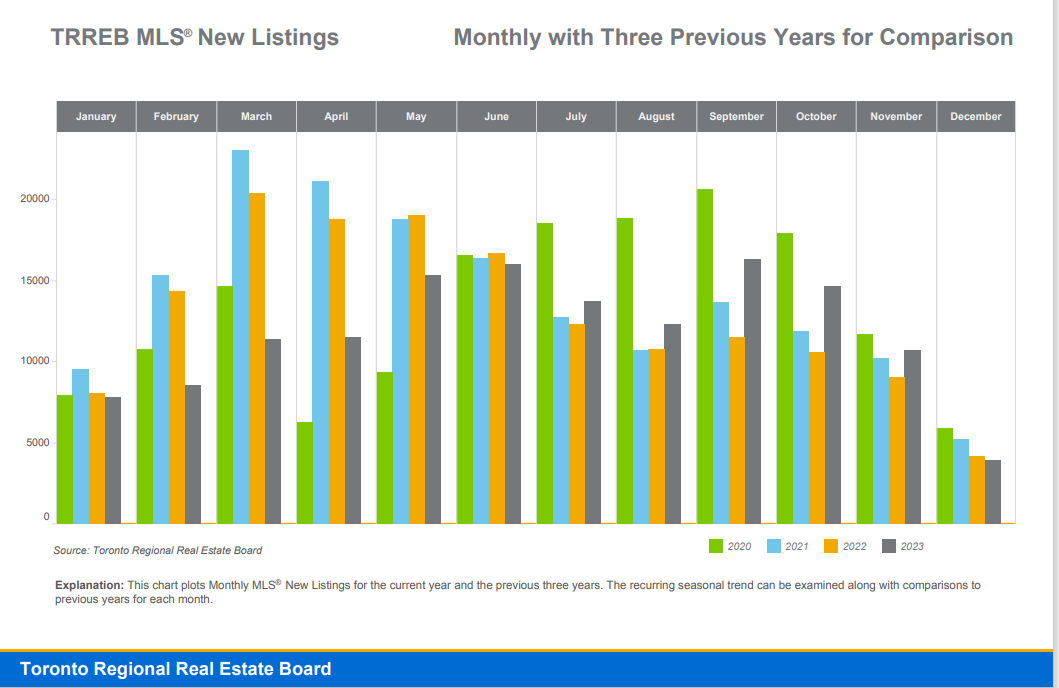
The inventory of New Listings is down 6.6% compared too December 2022. We will need to watch and see how much inventory becomes available as if the supply tightens the normal affects of supply and demand usually play out…increasing average prices.
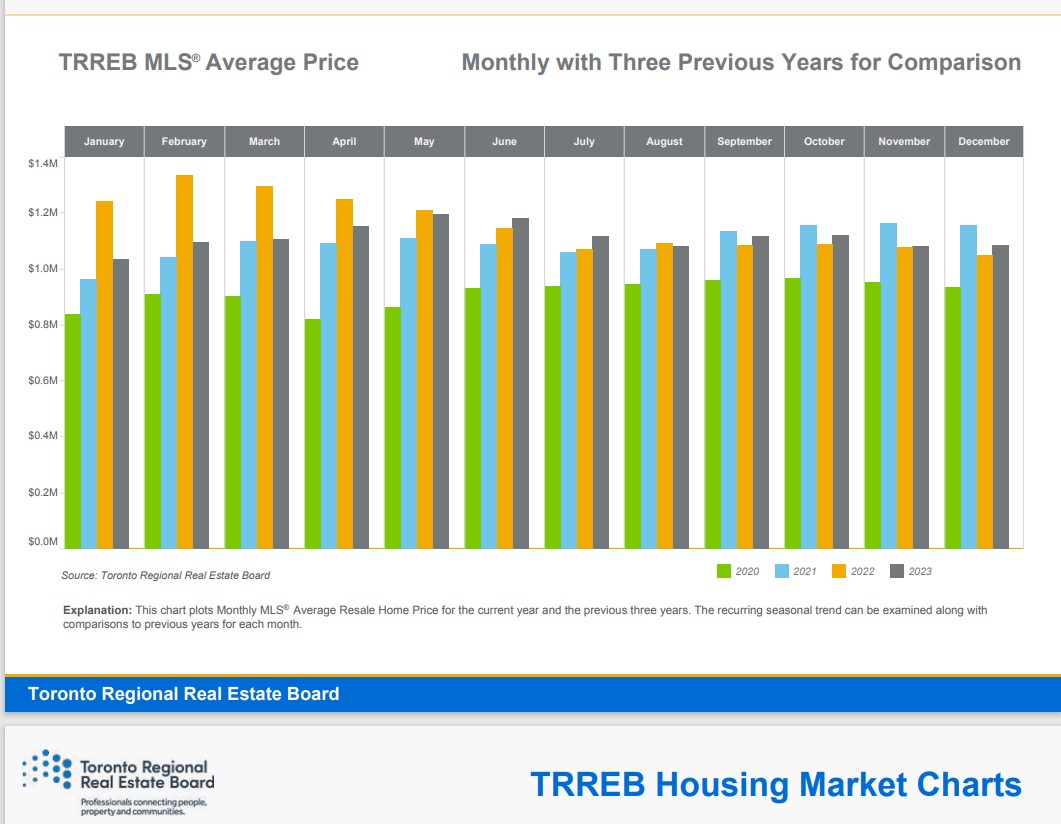
Finally the piece many are interested in. The average sale price on TRREB® for the month of December 2023 was $1,084,692.00 which is up 3.2% from the $1,050,569.00 average price for the previous December 2022.
“Property Days on Market” were 49 days as of December 2023 which is 22.5% longer than the 40 days on market noted as of December 2022.
IN CASE YOU DID NOT KNOW: Property Days on Market is a more clear picture of how long a property takes to sell – as listing days on market can be “reset” if a listing is expired or terminated and then it gets relisted on the system. The agent “refreshes” the listing, as they say. It is still the same property they are trying to sell and close to the same time period — but it seems like a NEW listing but just has a new MLS® number and a reset start date for when they listed it… This makes it appear that it has not been on the market for as long as it actually has been (but under a previous MLS® number.)
The stat for the “Listing Days On Market” you can see it is lower for as they only count from the date of the “new listing” even if it was on market prior before setting a new MLS number and “refreshing” it. Listing Days On Market were noted as only 32 Days on Market as of December 2023 which is an increase of 18.5% compared to December 2022 when they noted 27 Days on the market.
Call if any questions or to discuss this information. I am currently setting up my portfolio of new listings for the coming Spring Market and it is the best time to get your property readied for sale and evaluated so we can hit the ground running to get you listed in the best possible time frame. Please do not hesitate to call with any inquiries or if you are interested in purchasing or selling a property.
See in below the Charts showing the comparison for the December Market statistics for Sales, New Listings, Sales to New Listings, and Yearly Sales as compared to 2020, 2021, 2022, and 2023.

Denise Liboiron REALTOR®
Century 21 All-Pro Realty (1993) Ltd.

 Facebook
 X
X
 Pinterest
 Copy Link
